Tracking, measuring and crediting open collaborative behaviors
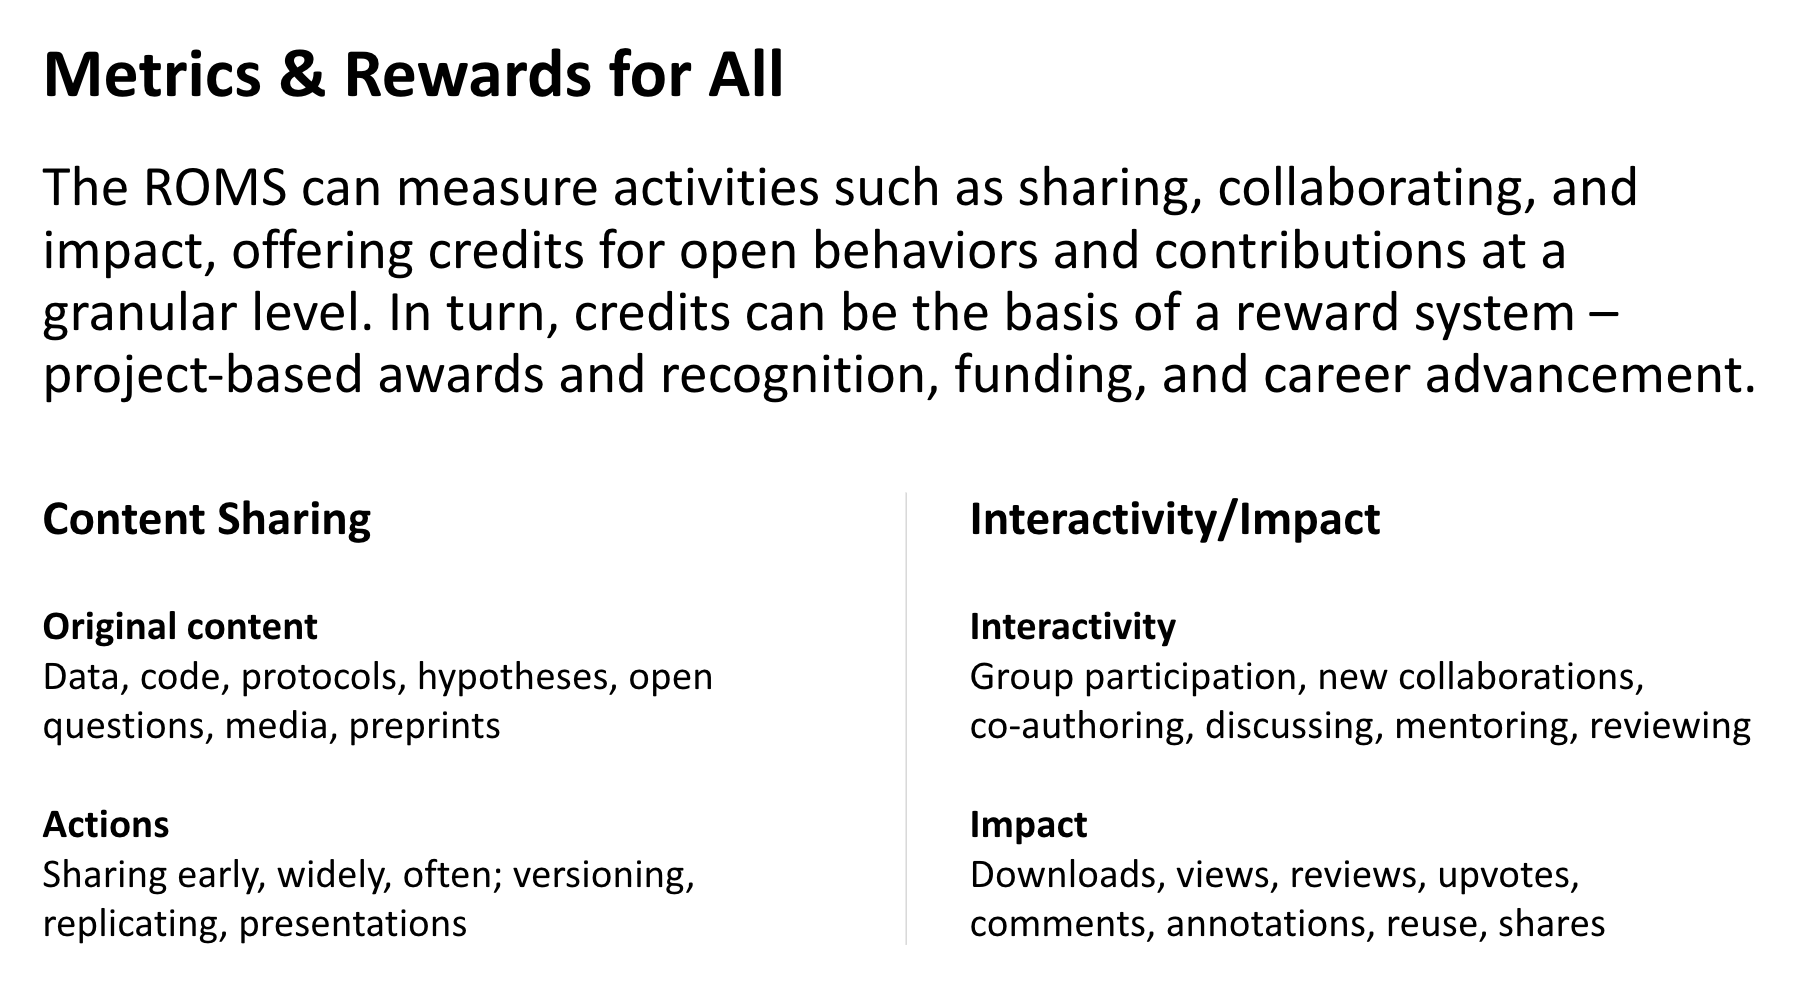
The Collaboration Score was conceived by Rapid Science and developed over the years by specialists in research, biostatistics, publishing, informatics, technology, philanthropy and open science advocacy. Its evolution is based on real-time problem solving with clinical researchers in the areas of prostate cancer, sarcoma, and Parkinson’s disease. The C-Score will provide funders and administrators an alternative to publishing metrics by tracking and rewarding all contributions to a research initiative.
How it Works
The C-Score is designed for use on multi-team initiatives for which open collaborative processes have been funded, promoted and enabled. The infrastructure for measurement requires a “hub” that features team members’ expertise, resources and progress; and tools/apps such as a “research outputs management system” (ROMS), easy access to open data repositories, and a discussion platform such as Google Docs for posting, tracking, discussing and revising incremental results (see Workspace section). In concert, these tools can measure, according to the needs of the project, levels of sharing, discussing, reviewing, and co-authoring by investigators who deposit data in repositories and engage in the platform. Other activities such as meeting attendance, presentations at conferences etc. can be logged manually (see chart below).

In addition to the metric, individual interactions and content can be assessed qualitatively through archiving and making searchable participants’ contributions, diminishing the possibilities for gaming scores. This also provides drill-down for hiring, career advancement and funding assessments by those who have expertise on the topic and can look beyond the C-Score.
A Model System
While this system has been designed for specific projects (cancer and PD), as shown in the models below, the full system has not yet been tested in real time. As noted above, it requires teams and funders committed to open collaborative research at the start of the project.
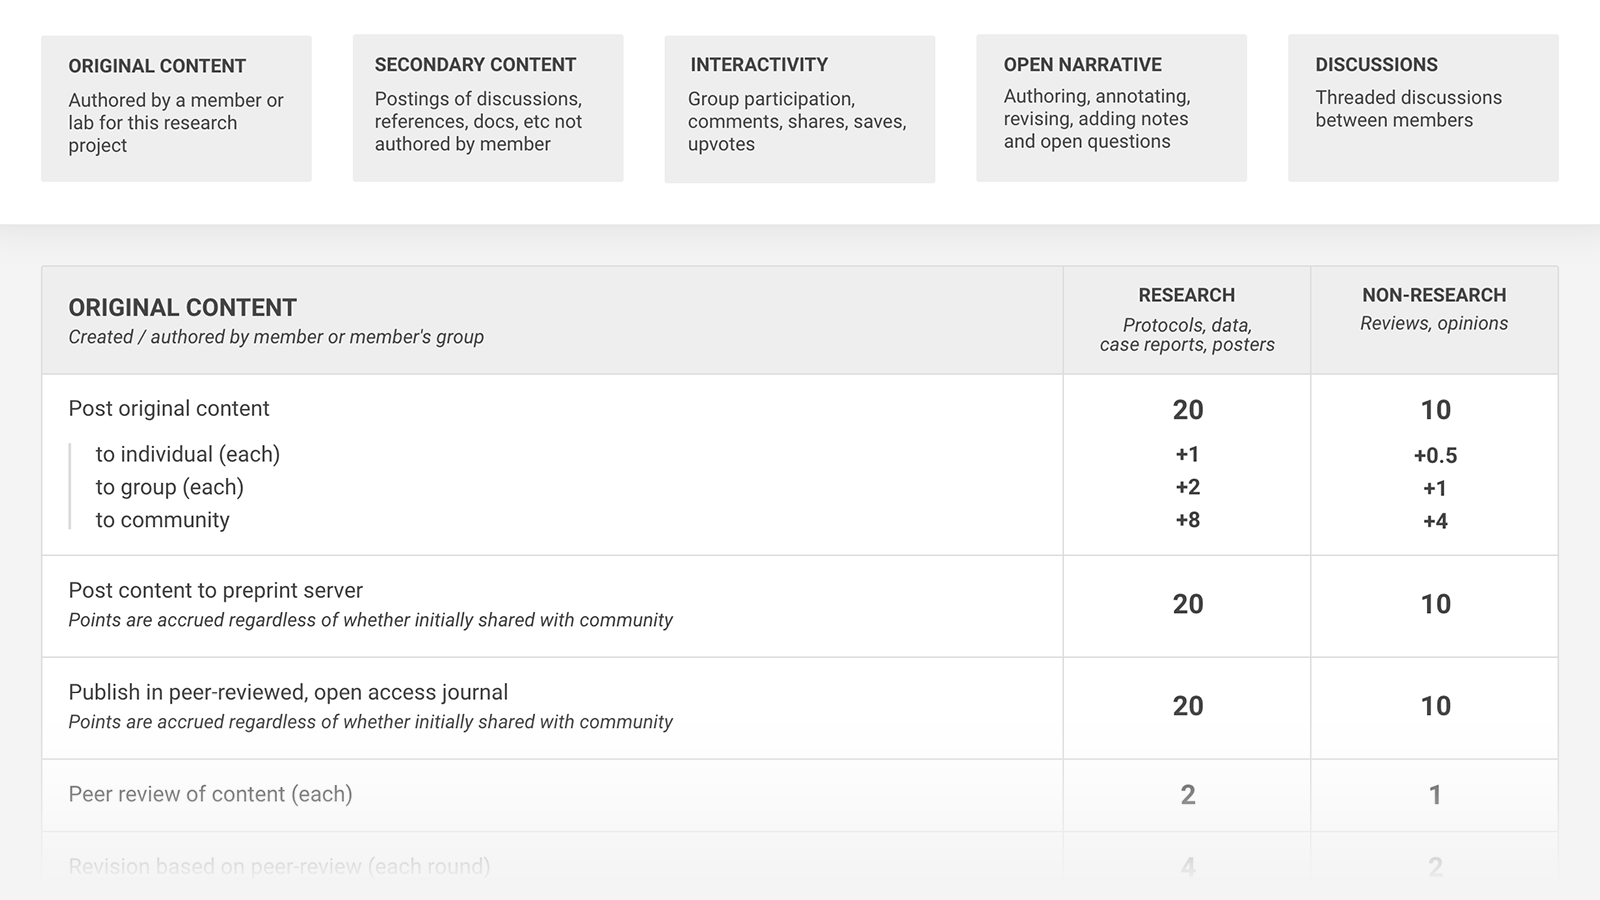
1. Credit Attribution
Credits for collaborative activities are determined at the start of the project by the funder and the team leaders/members. The sample below, with all its components, can be viewed in full by clicking on the partial table. [The Open Narrative listing is described in the Facilitation & Communication section.]
2. Team Dashboard with C-Score
This shows one team’s C-Score in the banner of their dashboard. Clicking the image below reveals (at the top right) an animated dropdown of the group’s activity over time and its comparison with the average of all active groups. The leaderboard lists the current top three contributors but not their scores.
3. Individual Dashboard with C-Score
Clicking the image below reveals (at top right) an animated dropdown of this researcher’s contributions and credits. While the score is visible only to herself, others can view her contributions and standing in the initiative. Individuals can unlock their own scores in an admin view for fellow researchers, funders, and institutional analyses.
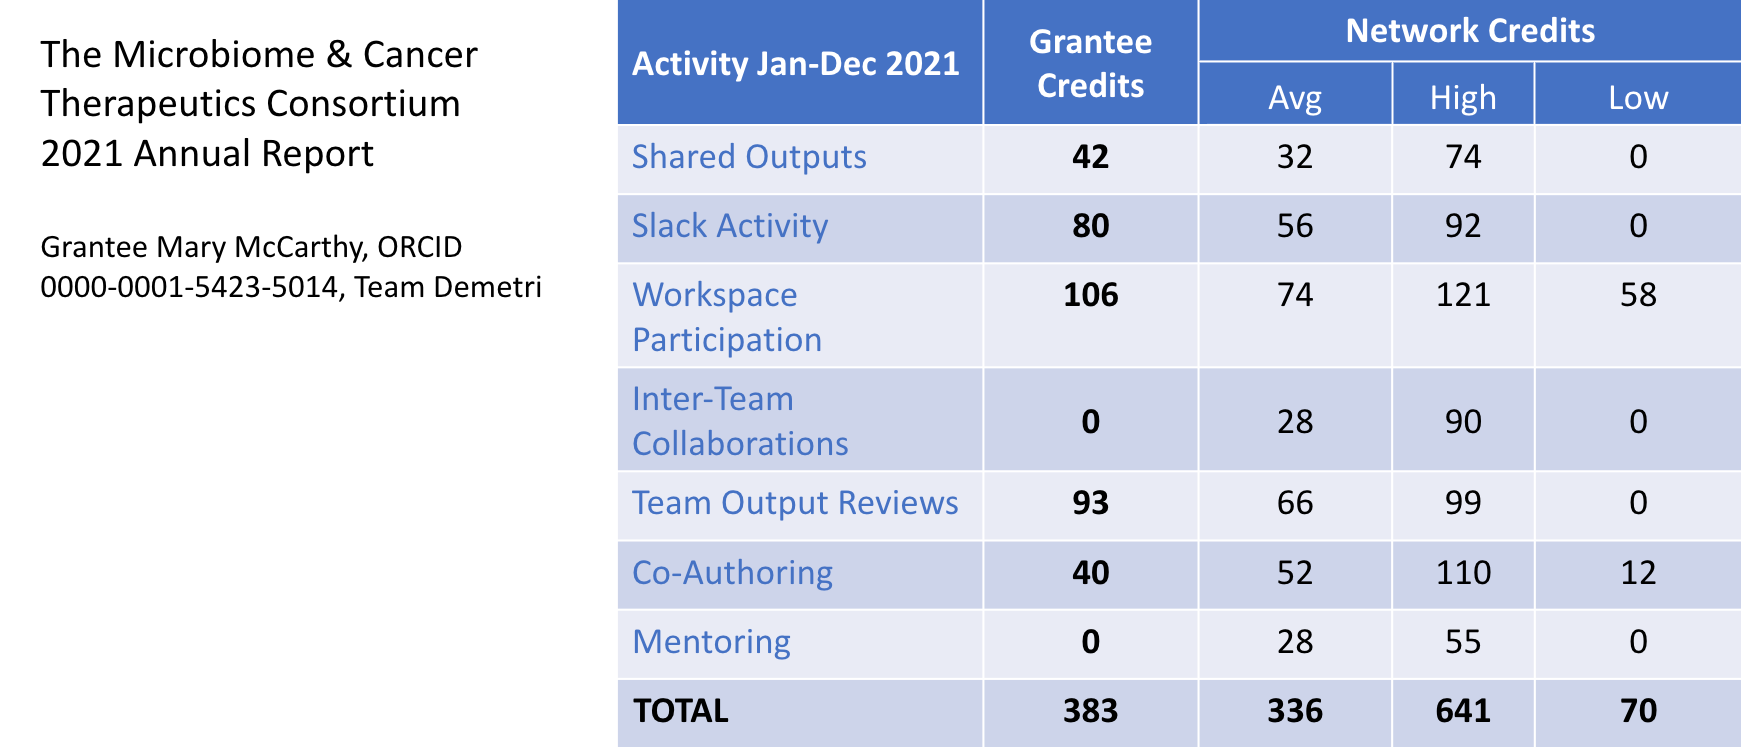
4. Grantee’s Annual Collaboration Report
This is a sample report generated for the funder and other interested evaluators, showing a researcher’s credits as compared with those in the entire network of teams.

5. Open Narrative as Versioned Preprint
This image demonstrates features of an Open Narrative with versioning information and access beneath the author’s names. Comments on the document are shown in the right column, color coded as “PR” = proposed revision, “AR” = accepted revision, “OQ” = open question, and “N” = note. These comments generate further discussion and updates to the Narration.
Authors’ names are listed in order of their C-Scores, and might also include all contributors to the research initiative (listed alphabetically), or just those who worked on the current version. The Editorial Facilitator who writes and maintains the versioned snapshots is included as well. Clicking the image shows an animated dropdown (at top left) that reveals how each individual participated and theresulting credits.
More detailed demos of the C-Score system have been designed and are available upon request.
Many thanks to retired Board Chair Bruce Alberts for strategizing and communicating the role and urgency of a new reward system for collaboration. His extraordinarily valuable feedback and encouragement were offered with patience and grace for more than a decade since the founding of Rapid Science.

